Optical Flow Proves Crucial in High Water Flow at Prado Dam
The monitoring of accurate and reliable flow data can be particularly challenging in certain site and hydraulic conditions when using traditional measurement methods. Many natural and man-made waterways, such as rivers, streams, and canals, often exhibit complex flow patterns and hydraulic characteristics that can make it difficult to obtain precise, representative flow data using standard techniques. Take, for example, the U.S. Geological Survey (USGS) gage located just below Prado Dam in Southern California, as shown in Figure 1.
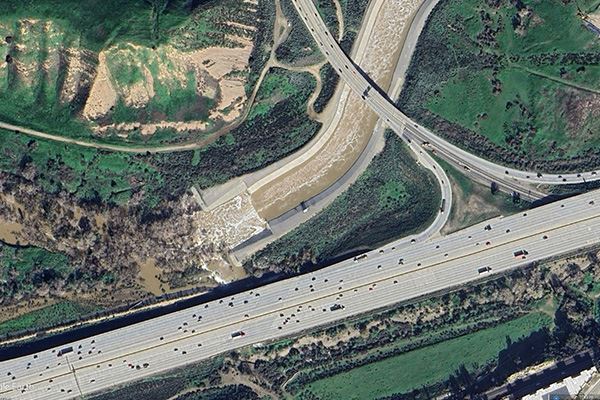
Figure 1: USGS gaging station 1107400, Santa Ana R BL Prado Dam, CA
The site plays a key role, as it monitors flow releases from the dam, which directly impact the water supply needed for two vital purposes: ensuring proper discharge into Orange County Water District’s (OCWD) groundwater recharge basins and maintaining sufficient water levels to support bird habitats. The reliability of the flow data is essential for managing water resources effectively.
The site is located 2,500 feet downstream of Prado Dam, a flood control structure on the Santa Ana River near Corona, California. Flow monitoring takes place within a concrete channel, which consists of a two-stage compound trapezoidal section (Figure 2), with the low stage centrally nested at 37 feet wide and 2.8 feet deep. The high stage of the compound section is 213 feet wide and 20 feet deep, designed to accommodate higher flow volumes.
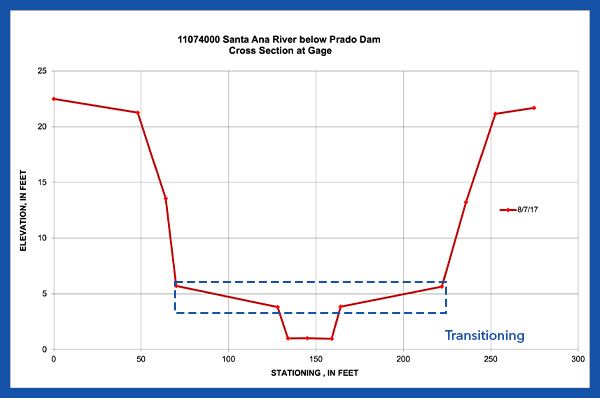
Figure 2: Two-stage compound trapezoidal section profile
Accurate flow measurements, particularly in the range of 250 to 1,000 cubic feet per second (cfs), are crucial for the OCWD groundwater recharge basins located downstream of the dam. Flows up to 1,000 cfs can be captured for groundwater recharge, while higher flows must be diverted downstream, where the Santa Ana River discharges into the Pacific Ocean.
The flow range, between 250 and 1,000 cfs, aligns with the transition section (see Figure 2) from low-stage to high-stage within the compound trapezoidal channel. Measuring flow during this transition is especially challenging. Conventional methods like wading measurements using the SonTek FlowTracker2 are impractical due to the water depth and velocity, while acoustic Doppler current profilers (ADCPs) such as the SonTek-M9 or -RS5 operation is impacted by the shallow water conditions within the transitioning section. This makes precise flow measurement exceedingly difficult under these conditions.
Historically, the USGS has made efforts to develop an accurate discharge rating curve at the site, but they have faced significant challenges in establishing a reliable relationship across the full range of flow conditions. To further improve the accuracy of the flow data reported, an upward-looking Acoustic Doppler Velocity Meter (ADVM) was installed with the development of an index velocity (IV) rating. Unfortunately, the development of the IV rating has not been successful at the USGS gage due to the extreme flow conditions. The turbulent flow conditions and high sediment transport made it challenging to measure accurate and reliable flow data with an ADVM instrument.
In August 2022, the University of California San Diego (UCSD) Center for Western Water and Weather Extremes (CW3E), as part of work funded by FIRO, installed a cutting-edge Computer Vision Stream Gauging (CVSG) system at the site shown in Figure 3.
The CVSG system makes use of stereo cameras for remote sensing of surface velocities and water level to develop an adaptive learning discharge rating curve for flow calculations. The real-time monitoring of surface velocity changes within a channel reach allows the CVSG system to develop an accurate stage-discharge relationship in an exceptionally short timeframe. The CVSG rating is continuously assessed from instantaneous discharge, surface velocity and water level measurements by the system over consecutive flow events to provide an accurate flow record within the flow monitoring site and hydraulic conditions.
The process works by remotely capturing surface velocity using stereo video footage, which is then analyzed with the Farneback algorithm to determine the water’s speed. Once the surface velocity is known, it is converted into discharge by calculating the mean velocity (following Hauet et al. 2018) and multiplying it by the cross-sectional area of the channel. This area is determined using water level data and a cross-section survey, allowing for an accurate calculation of volumetric flow.
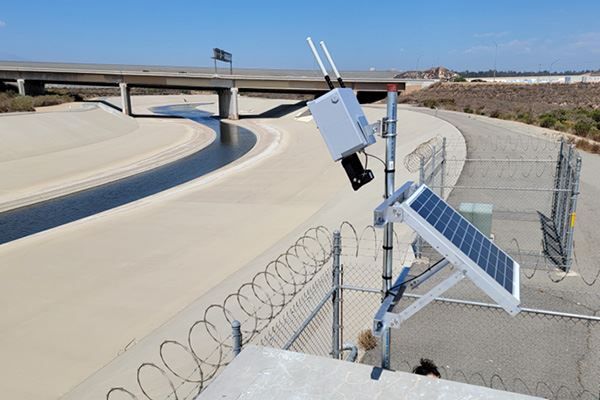
Figure 3: CVSG system installed at USGS gaging station 1107400, Santa Ana R BL Prado Dam, CA.
The appeal of the new and innovative CVSG system is that it can remotely measure the water surface velocity over a wide range of flow conditions and then develop an adaptive learning discharge rating curve without relying on manual streamflow measurements. Additionally, this method does not require a minimum depth or ground control points to measure velocity. Conditions that are typically challenging or impossible using wading methods or ADCPs can be ideal for CVSG. If the section is visible and there is consistent water surface texture, the system can measure surface velocity, compute discharge, and refine its rating through a wide variety of flow conditions.
The CVSG system was installed at the site specifically so that its adaptive learning discharge rating curve could be compared against the USGS rating for this site and the Prado Dam releases upstream. As mentioned, the USGS rating has not captured the entire range of flow accurately, according to cross-referenced dam releases and flow measurements downstream of the USGS gage, though all three references agree at the lower and higher end of the flow range.
Flow range in the channel varies considerably from low flow during the summer and fall, with flows averaging around 80 cfs and peak water velocity of about 3 ft/s. During the flood season, flows as high as 7,000+ cfs and peak water velocity reaching 11 ft/s can be expected.
In February 2024, following an exceptionally wet flood season, the U.S. Army Corps of Engineers (USACE) made record releases from Prado Dam, exceeding 7,000 cubic feet per second (cfs). During this time, teams from the USGS, CW3E, and SonTek made multiple attempts to capture accurate flow measurements using ADCPs (Figure 4), with both moving boat and stationary methods. After performing a series of streamflow gauging’s with different ADCP instruments, the SonTek-RS5 equipped with RTK provided the most consistent flow results.
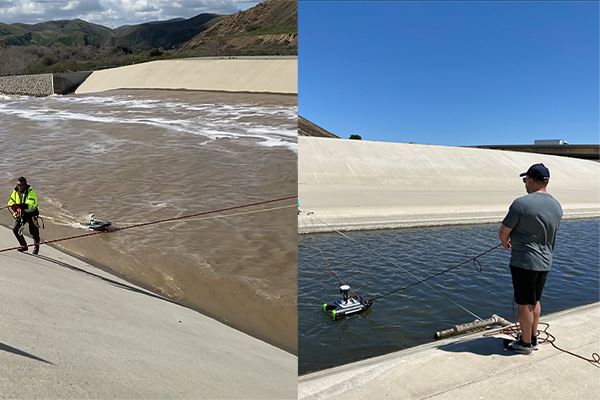
Figure 4: ADCP Streamflow gauging’s with RiverSurveyor M9 and RS5. High flow conditions left, low flow conditions right.
The data collected with the SonTek-RS5 was used to further develop the USGS rating. The adaptive learning discharge rating curve developed by the CVSG system aligns closely with the ADCP measurements, the USGS rating, and Prado Dam gated outlet release rating shown in Figure 5. The CVSG system developed rating curve independent of streamflow gauging’s performed during flow releases, demonstrating that the CVSG is a matured flow monitoring solution that performs just as well as traditional methods at this challenging site.
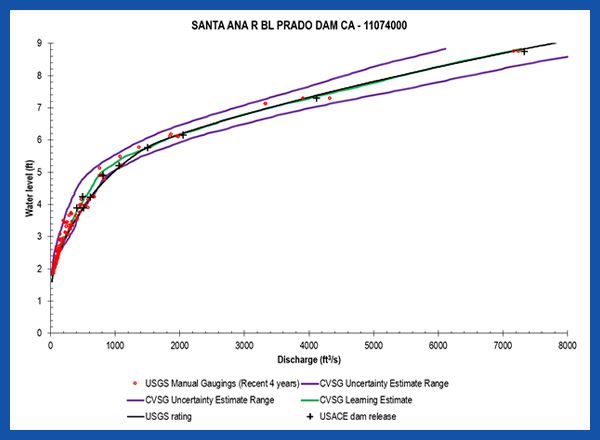
Figure 5: Comparison of USGS wading and ADCP discharge measurements, USGS rating, CVSG Learning estimate (rating), USACE Prado Dam release data, with CVSG rating uncertainty estimates.
This result is an exciting breakthrough for CW3E and their collaborators as they explore new, adaptable methods to accurately measure flow at challenging sites where traditional approaches fall short. At Prado Dam, their specific goal is to retain more water during the flood season, allowing for a more consistent release during the dry season to maximize groundwater recharge. This is crucial for the Orange County Water District, especially as imported water becomes more expensive and less reliable.
The CVSG system delivered reliable data even in extremely high-flow conditions at this difficult site and developed a rating curve in a much faster timeframe than traditional methods would allow.
