How Do Flow Probes Measure Velocity?
If you’re a hydrologist or water technician, you probably remember one of your earliest lessons involved a field trip out to a local canal or stream to learn how to measure water velocity with a tape measure, float, and timer. Trudging out to the middle of the stream while your buddies stretch out the tape measure, you drop in a tennis ball at the ‘Start’ point and watch it meander downstream, getting caught on cobbles and eddies along the way, until you catch it at the end of the reach and mark the seconds.

You can use a leaf, ball, or even a rubber duck to determine stream velocity with the ‘float method.’
It may not be the most accurate flow rate measurement you’ve ever taken, but like all of us water people, you look back fondly on these scientific rites of passage. They help ground our experience and understanding of the complex world of environmental monitoring.
While it’s still a valid method to do float-based flow measurements, technology has expanded our options. From automated weir networks to wading discharge measurements with an acoustic Doppler velocimeter (ADV) like the FlowTracker2 or an impeller-based instrument like the Flow Probe, these methods all follow the same principles of stream velocity measurement.
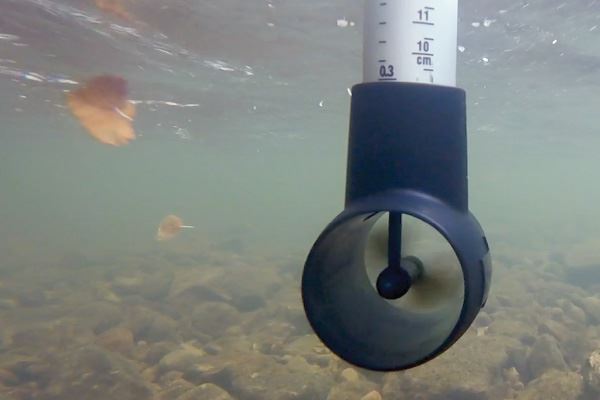
The YSI Flow Probe impeller as seen underwater.
Velocity is an important variable in calculating the flow, or discharge, of a waterway. To oversimplify the complex physical nature of a flowing system, let’s look at one of the formulas used to calculate discharge. Q, discharge, is calculated as the cross-sectional area of flow, A, multiplied by velocity, V.
Q = AV
In a pipe with uniform flow, this equation is simple because A and V are constant along its length.

In open channels, to maintain a constant discharge, the velocity changes as the cross-sectional area changes.
Water velocity can vary throughout the channel because of friction between the water and the substrate, surges in velocity over time, turbulence, eddies, and large obstructions like cobbles, boulders, and woody debris.
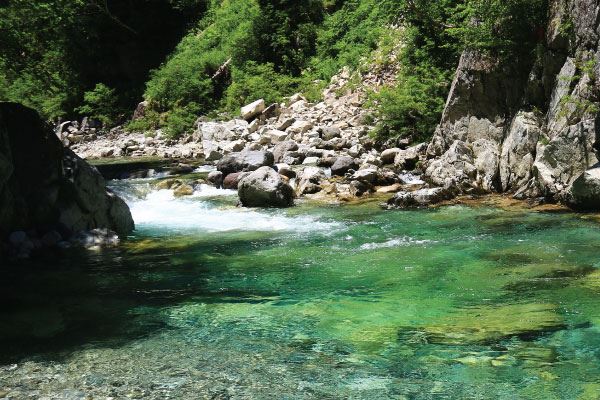
Looking upstream, surface water flow can be irregular depending on obstructions and channel characteristics.
In addition to this, velocity also varies with depth, as a function of the distance from the streambed, due to friction and the physical properties of water. In general, the velocities are greater in the center of the channel or near the surface and lower near the bottom and sides of the channel.
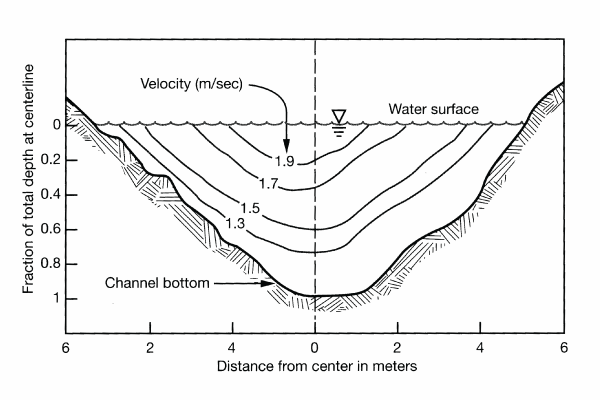
This diagram illustrates how vertical velocities can vary in the water column.1
In a small channel, one velocity measurement at the vertical station with the deepest flow, known as the thalweg, is sometimes sufficient to accurately calculate discharge. In a large river or stream, many average velocity measurements are taken across the cross-section (typically at least 10-20 measurements) within a representative reach of a channel or stream. The velocity data, paired with the appropriate equation that computes the area of the open channel, contributes to the accurate calculation of discharge.3
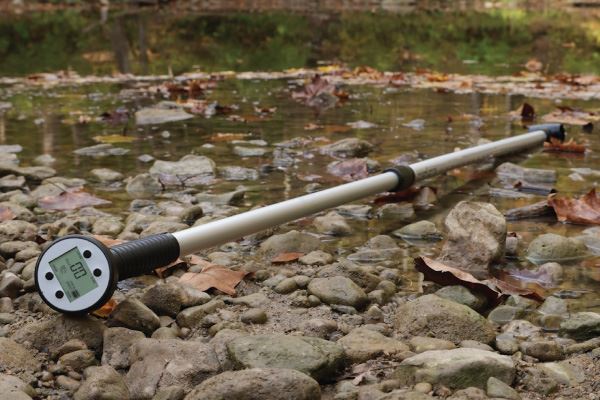
The YSI Flow Probe is a flow meter, an instrument used to measure water velocity.
When collecting velocity data using a flow meter, like the Flow Probe or FlowTracker2, a method commonly invoked by the U.S. Geological Survey (USGS) is the “six-tenths method,” in which a single measurement is taken at approximately 60%, or 0.6, of the depth of the channel.2 This measurement is assumed to be the average vertical velocity point.
In the previous diagram, the average velocity at the thalweg station (the dotted line at center) is 1.5 m/s, using the six-tenths method.
According to the USGS, observations and mathematical theory have shown that the six-tenths method is reliable and accurate, and it is ideal for taking quick velocity measurements; however, it should be employed only when the channel depth is between 0.3 and 2.5 ft.2 At greater depths, the two-point method may be used by taking velocity measurements at 0.2 and 0.8 of the water depth.2 In more shallow flow, a one-point velocity measurement at the lowest possible depth may be the only feasible method.
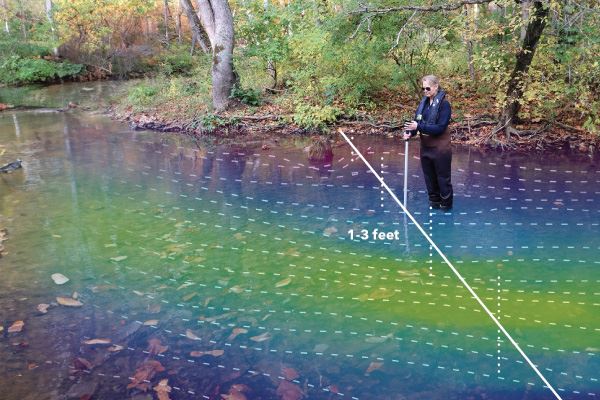
Using the YSI Flow Probe to collect velocity measurements every 1-3 feet in a vertical cross-section.
Another method to obtain the average vertical velocity specific to the YSI Flow Probe is using its Continuous Velocity Average mode. The probe can be moved slowly and smoothly through the water column from the water’s surface to the bed, taking velocity measurements as the depth changes. By using an even technique, the probe spends the same amount of time averaging velocities at each depth, resulting in a true average velocity measurement.
For small channels and pipes, this continuous averaging measurement can be employed throughout the entire cross-section at once, resulting in one value representing the average velocity. For larger streams or rivers, continuous velocity averages can be collected at many vertical stations across the cross-section. With the Continuous Velocity Average, less time can be spent determining the best depths at which to take measurements since the probe is moved evenly throughout the water column in the same way, no matter the depth of the channel.
Since flow meters like the Flow Probe can make quick work of collecting velocity measurements and even log measurements in the instrument, you can get faster, more accurate velocity data that can be plugged right into your discharge calculations.
If you’d like to see the Flow Probe in action, please check out this video!
Sources:
- University of Texas, Dallas, Measuring Velocity
- The U.S. Geological Survey, Discharge Measurements at Gaging Stations
- University of Texas, Open Channels