Long-Term Monitoring of an Estuary
The Grand Bay National Estuarine Research Reserve (NERR) in Mississippi is one of 27 protected estuarine reserves across the United States. The reserves serve as platforms for long-term research and monitoring, as well as reference sites for comparative studies. At the Grand Bay NERR, an in-situ water quality monitoring system coupled with a near real-time telemetry system allows managers and technicians to monitor changes in water quality at various temporal scales, providing a greater understanding of the ecosystem dynamics and better management of the monitoring program.
The near-real-time access to the data enables improved management decisions of the environment and monitoring equipment.
Water Quality Monitoring System
The monitoring system consists of four water quality monitoring stations (Figure 1). These stations have YSI multiparameter water quality sondes that collect data every 15 minutes. Three of the water quality stations have data nodes that transmit data to a master node located on a weather station. One remotely located water quality station has a stand-alone master node. The two master nodes transmit data to a central server on an hourly basis.
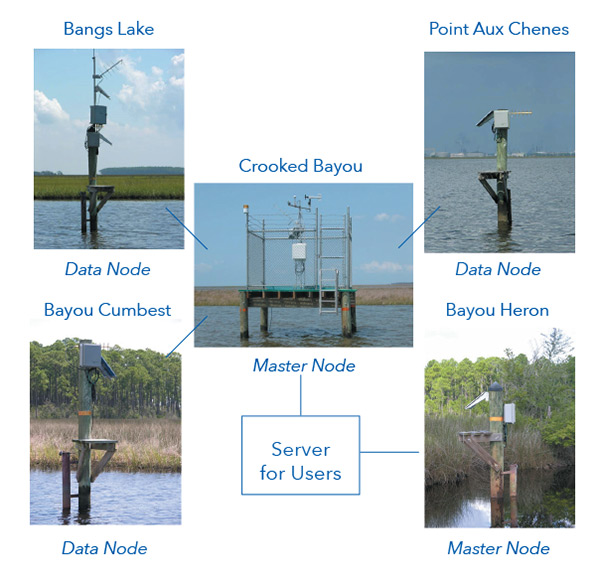
Figure 1: Continuous monitoring scheme
The monitoring program rotates two sondes per site, meaning that at the time of maintenance, previously deployed sondes are removed and freshly calibrated sondes are installed. After this, previously deployed sondes are put through the QA/QC process and then cleaned for the next rotation.
Data During a Hurricane
The sondes collect data for temperature, specific conductivity, salinity, pH, dissolved oxygen (% saturation and mg/L), turbidity, water level and battery voltage. These sensors provide the data necessary to monitor the health of the ecosystem and to track the impacts of natural or man-made events (Figure 2).
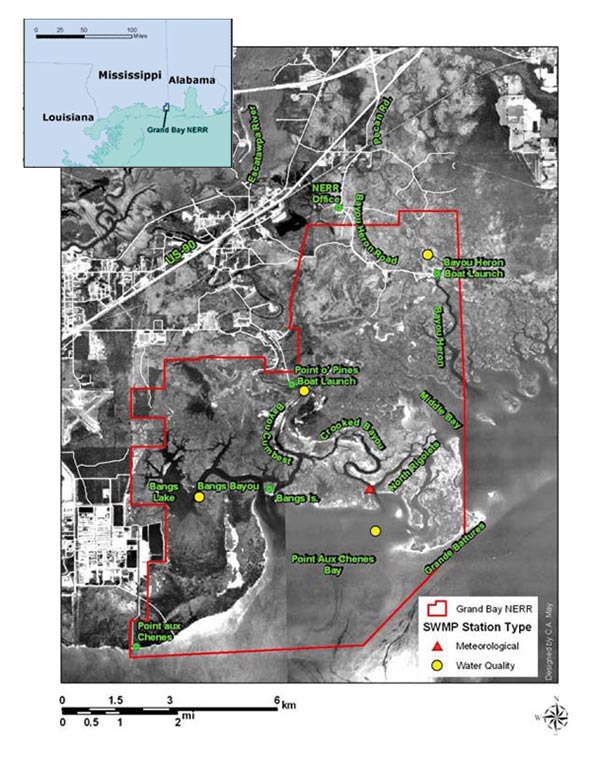
Figure 2: Continuous monitoring locations in the Grand Bay estuary
The sonde is ideal for long deployments and incorporates wipers to remove biofouling from optical sensors and a brush to remove fouling on dissolved oxygen, conductivity/ temperature, and pH sensors. (Watch, EXO Wiped Sensors video). To further extend deployments, copper-alloy anti-fouling kits have been developed for the sensors; all of this reduces the operating cost by extending maintenance intervals and maintains data quality. (Learn more, 7 Tips to Fight Fouling and Extend Water Quality Sonde Deployments).
Data from Hurricane Katrina are highlighted in Figure 3. The dark blue line represents water level data. The red line indicates the elevation of the telemetry box. Data indicates the unit was submerged by 2.6 ft (0.8 m) of water for about 3.5 hours during the storm surge, which reached 14.19 ft (4.3 m) at this site.
Initial DO, salinity, and depth data demonstrate the tidal influence at the site. Post-storm salinity data demonstrate the diluting effect of the rain associated with the storm. The DO data demonstrate typical post-storm hypoxia. Excess biota in the water column increases the demand for oxygen. The heavily mixed water column accounts for the increase in turbidity.
Figure 3 highlights the ease at which data can be displayed. The actual data highlight the robustness of the monitoring system. This system withstood hurricane conditions and resumed data transmissions after being submerged for over three hours.
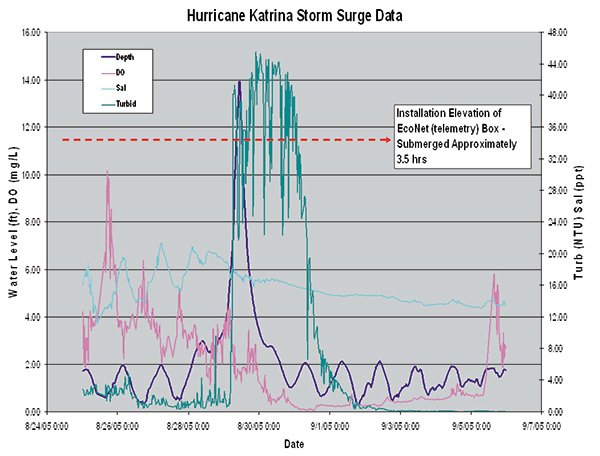
Figure 3: Storm surge data during Hurricane Katrina
Benefits of Real-Time Telemetry
“In-touch” with data every hour
- Identifies problems when they happen
- Maintains data quality
Save resources
- Prevents unnecessary trips to stations
- Fewer trips mean less money spent and increased efficiency
Interactive – two-way communications
- Set up alerts for near real-time warnings
- Troubleshoot equipment remotely
Robust and durable
- Able to withstand hurricane-force winds
- Transmits data after complete submersion
This was originally presented as a poster at the National Conference on Ecosystem Restoration by Mike Cook, PhD, YSI Inc;. Christine Walters, Grand Bay National Estuarine Research Reserve; and Mark Woodrey, PhD, Grand Bay National Estuarine Research Reserve.

Additional Blog Posts of Interest
Harmful Algal Blooms | Everything You Need to Know
Real-Time Water Quality Data Used to Protect Ecosystem During Dredging
Irrigation District Relies on Continuous Water Usage Information
7 Tips to Fight Fouling and Extend Sonde Deployments | Tip #1